
Thermodynamic multi-gas odor analyzers for monitoring drug and no smoke powders.
The project is carried out by prof. Vlastopulo’s team, Ukraine
Thermodynamic multi-gas odor analyzers can be used for different purposes, in this startup we offer to monitor the presence of various narcotic substances and smokeless powders. Thermodynamic multi-gas analyzers are manufactured industrially by us, but for each narcotic, calibration and debugging are done separately, depending on the customer's wishes. Customers can be customs, police, and other interested companies. Monitoring can be carried out, for example, in an open area of 50 by 100 meters, automobile customs, where monitoring units for certain substances are located. When an odor hits the gas analyzer, a photo SNAP CHAT is triggered, a siren sounds, or an alarm call is sent to the responsible persons via a telegram channel. The entire network can be installed on the website of an institution with constant monitoring of narcotic substances in 24/7 mode, for example, up to 1000 gas analyzers.
Currently, we are at the stage of proposals to government organizations in Ukraine.
Main directions
I have at least 150 scientific papers and patents of Ukraine, the Russian Federation, the Soviet Union and the European Patent in Russian until 1997 under the name Lukashenko and after 1997 under the name Vlastopulo, mainly in English., monographs, books, participation in the largest congresses and symposia in the world.
Engineering Calculation of Hydrodynamic Plain Bearings: Theory and practice of experiment Methods and devices for measurement of elastohydrodynamic parameters of plain bearing Paperback – 31 Aug. 2010
English edition by Vladyslav Vlastopulo (Auteur)
https://www.amazon.com.be/-/en/Vladyslav-Vlastopulo/dp/3843350418?language=en_GB
Implant joints on basis of elastohydrodynamic theory of lubricant: Theory and experimental practice of elastohydrodynamic theory of lubricant for human implant joints Paperback – June 11, 2010
by Vladyslav Vlastopulo (Author)
https://www.amazon.com/Implant-joints-elastohydrodynamic-theory-lubricant/dp/3838352386
Proceedings of the 3rd International Conference on Energy and
Development - Environment - Biomedicine (EDEB'09)
Vouliagmeni, Athens, Greece
December 29-31, 2009Plenary Lecture 3: The Constructions of Implant Joints on Basis of Elastic Hydrodynamic
Theory of Lubricant
11
Vladyslav Vlastopulo
https://www.wseas.org/multimedia/books/2009/vouliagmeni2/EDEB.pdf
Journal article // Quantum Journal of Engineering, Science and Technology
Equations Of Thermodynamic For Expansion And Filling By Human Civilization
2021
Vladyslav Ivanovich Vlastopulo, Aglaya Georgievna Polychronidi
https://www.neliti.com/id/publications/524738/equations-of-thermodynamic-for-expansion-and-filling-by-human-civilization
Technology of saturation or dilution of calcium in bone and cartilage tissues in osteoporosis
- V. I.
Vlastopulo

From the journal Biomedical Engineering / Biomedizinische Technik
https://doi.org/10.1515/bmt-2012-4322
From basic science to clinical practice
5th Central European Congress on Obesity
XXIII. Annual Congress of the Hungarian Society
for the Study of Obesity
NEW METHOD OF WEIGHT LOSS By
ACUPUNCTURE TOURMALINE vIBRATIONAL
ExPOSURE FOR GENERAL POPULATION
Vladyslav Vlastopulo (Germany)
Proceedings of the 5th WSEAS International Conference on
CELLULAR and MOLECULAR BIOLOGY, BIOPHYSICS and
BIOENGINEERING (BIO '09)
Proceedings of the 3rd WSEAS International Conference on
COMPUTATIONAL CHEMISTRY (COMPUCHEM '09)
Puerto De La Cruz, Tenerife, Canary Islands, Spain
December 14-16, 2009
Plenary Lecture 2: Creation of Electromagnetic Structure-Creating Spaces to Improve the
Growth of Some Types of Cells and Albumins
12
Vladyslav Vlastopulohttp://www.wseas.us/e-library/conferences/2009/tenerife/BIO-CHEM/BIO-CHEM-00.pdf#%5B%7B%22num%22%3A28%2C%22gen%22%3A0%7D%2C%7B%22name%22%3A%22XYZ%22%7D%2C0%2C842%2Cnull%5D
http://www.wseas.us/e-library/conferences/2009/tenerife/BIO-CHEM/BIO-CHEM-00.pdf
11th International Congress of the IUPESM - Medical Physics and
Biomedical Engineering World Congress 2009 - For the benefit of
the Patient Program11:45 The way of treatment the drug abuse patients by the computerized fragmentary images in the Internet
Vladyslav Vlastopulo (Biomedical Engineering, Ukraine)
3rd WSEAS International Conference on ENGINEERING
MECHANICS, STRUCTURES, ENGINEERING GEOLOGY
(EMESEG '10)
International Conference on Geography and Geology 2010
(WORLDGEO '10)
Corfu Island, Greece, July 22-24, 2010Space Directed Coils for Biological Objectives 63
V. I. Vlastopulo
https://www.wseas.org/multimedia/books/2010/Corfu/EMEGEO.pdf
Gas Analysis Codivirus Method for Detecting the Threshold of Contagiousness and
Therapy Adjustment
Authors: Vlastopulo.V.I., Chaadaev. I. E., Gazin.A.V.
https://ijoer.com//assets/complete-issue/Volume-8-Issue-5-may-2022.pdf
The physical essence of the thermodynamic multi-gas analyzer is to measure the first odorous substances to the heads of the gas analyzers in the mode of a nonequilibrium system of propagation of this smell.
Each MQ sensor is calibrated for this smell. The microcontroller analyzes all the heads of the gas analyzers, compares them with the calibration curves and gives the result when determining the smell of a substance containing 10 to the minus 10, 11th degree. This startup is a pioneer and there is no point in patenting it in any country or union. Using the prototype and the principles laid down, you can patent our sensor under your own name and a competitor can steal it from us. We have experience in patenting a utility model in different countries under our names and we can show it. Below is a scientific paper published in the central scientific press of the world. We did something similar with bicarbonate in saliva when determining the degree of covid disease in the field by human exhalation.
The work was carried out by the scientific and production company Harvard Marine together with the private enterprise Scientific Research Institute of Life and Ecology.
The essence of the pioneering invention, which will be followed by our inventions and scientific works approved for publication, as well as other developers, is the emission from the surface of a solid substance or solution or gaseous substance into the air. Each emitted substance has its own molar mass, so air has a molar mass of 28.97 g / mol, the chemical formula of opium (C17H19NO3), the chemical formula of amphetamine (C9H13N), the chemical formula of hallucinogenic mushrooms, psilocybin (C12H17N2O4P), the chemical formula of citronellol (cosmetics, odors) (C10H180O), the chemical formula of geraniol, (cosmetics, odors) (C10H18O), the chemical formula of limonene (cosmetics, odors) (C10H16), etc.
The more hydrogen, the more volatile the substance, the more carbon, the heavier the substance and falls down, the more nitrogen, the heavier the substance and the faster it falls down. Tested in practice.
It is not without reason that animal feces contain more nitrogen, and the respiration of plants and animals is oxygen, a light gas, and they emit a heavier carbon dioxide. Therefore, oxygen absorption by plants is carried out by the foliage at the top.
The nose is at the top to inhale light gas, and defecation is at the bottom. Defecation is always lower and behind in mammals and reptiles.
That is, substances with a heavy molar mass fall down to the ground in the air, and substances with a light molar mass fly up from the place of emission in the air.
Therefore, our multi-gas analyzers must be installed below, near the ground! Since the absolute amount of substances detected are heavy substances.
Each substance has its own differential path dS Know-how and differential time dT Know-how, the propagation of a given molar substance in the air. This is the basis for the calibration of a given substance depending on its concentration and on the differentials of Conductivity dQ, Current dA, Resistance dR of a detector of a gas analyzer of a given type.
The count is carried out on the basis of differentials of the path and the time of passage of a given molar mass in the air.
adc1 //Analog value from the detector coefV = 0.1875 //constant for ADC accuracy
d = 1000 //divider to obtain the value in volts
0.? //Constant derived empirically Know-how
V = 5 //5 volts detector power supply 10000 //divider to obtain Ohms
Ro = 122 //Resistance in clean air
All data are combined into a system of nonlinear equations of thermodynamics of a nonequilibrium system
Unlike a service dog, the gas analyzer cannot be affected by another smell. This project is similar to the Neyro network USA Nasal Computer, but unlike it, it was developed based on an experiment and not by calculation. The calculation always differs from reality and is confirmed only by experiment.
Investment Proposal:
Thermodynamic Multi-Gas Odor Analyzer
1. Project Overview
Thermodynamic Multi-Gas Odor Analyzer is an innovative device for analyzing vapors and odors to detect narcotic substances, including synthetic powders and spices.
The technology is aimed at the security, transportation, customs control and scientific research markets.
________________________________________
2. Problem and Solution
Problem:
• Increasing number of synthetic drugs.
• Difficulties in inspecting baggage and cargo.
• Need for prompt testing of substances in the field.
Solution:
A compact, highly sensitive analyzer capable of detecting trace concentrations of gases in real time. The device can be used both at mobile and stationary control points.
________________________________________
3. Market
• The global market for solutions for the detection and analysis of hazardous substances exceeds $8 billion (as of 2023).
• Expected growth (CAGR): about 6.5% annually.
• Key regions: European Union, USA, Middle East.
• Potential clients: government agencies, customs, airports, logistics centers, research institutes.
________________________________________
4. Market entry strategy
1. Pilot launch in two EU countries through partner labs and security services.
2. Participation in industry exhibitions (Intersec, Milipol, Homeland Security Expo).
3. Direct B2B sales and participation in public procurement tenders.
4. Localization (translation of interface, documentation, technical support in 5 languages).
5. Development of an online platform for tracking and updating firmware.
________________________________________
5. Monetization model
• Sale of the device: from €6,000 per unit.
• Analytics software subscription: €500 per year per device.
• Service and calibration: €300 per year.
• Future-proof model: licenses and franchises for international expansion.
________________________________________
6. Return on Investment (ROI) forecast
Indicator Value
Cost of one device €2,000
Selling price €6,000
Planned sales (year 2) 100 units
Revenue for year 2 €600,000
Profit (approximate) €350,000
Payback period 12–16 months
________________________________________
7. Investment requirements
Total amount: €75,000
The funds will be used for:
• Finalization of development and certification
• Production of the initial batch (5–10 devices)
• Creation of a website and marketing materials
• Participation in industry events
• Market analysis and entry into distribution
________________________________________
8. Offer to the investor
• Form: equity participation / return with interest / hybrid
• Offered share: 15–25% for full investment
• Alternative: return on 35% of profit within 18 months
• Possibility to participate in scaling the project to the international market
________________________________________
Contacts
Email: vlastopulo0722gmal.com
Phone: +380-996776823
Team:
Founder
1. Vladyslav Vlastopulo, SEO, Director of Harvard Marine, professor-consultant, Doctor of technical sciences in mechanical engineering, creator of the thermo-elastohydrodynamic theory of lubrication of heavily loaded plain bearings, author of a number of well-known works Elastohydrodynamic theory of lubrication of knee and hip implants, well-known Eslengen Tribological Academy, student of Fedor Snegovsky, currently specializing in tribological, ecological and biomedical engineering. Scientific director of the project.
Founder
2. Igor Chaadaev, research engineer, experiment director,
artificial intelligence programmer, electronics engineer, microcontroller
programmer, gas analyzer equipment developer.
Founder
3. Andrey Lukashenko, mathematician,
biophysics air engineer.
Others developers
4. Vitaly Svirida, senior researcher, electronics engineer, microcontroller programmer, developer of gas analyzer equipment.
5. Sergey Nesterenko, senior researcher, research engineer, experiment director, electronics engineer, microcontroller programmer, developer of gas analyzer equipment.
6. Marina Noskova, biophysics air engineer.
Gas Analysis Codivirus Method for Detecting the Threshold of Contagiousness and Therapy Adjustment
Vlastopulo.V.I.1, Chaadaev. I. E. 2, Gazin.A.V. 3
1Biophysical Department, Reseach Institute of Life and Ecology, Odessa, Ukraine.
Email: vlastopulo@te.net.ua
Abstract— To date, there is no easy-to-use method and device for its implementation for the detection of codivirus-infectious people by exhalation. The main method of covid infection is airborne when droplets of the infected saliva person enter the oral cavity of healthy person. Such method would make it possible to detect infected people and prevent them from entering in public places and send them to quarantine immediately. The method is not traumatic, unlike the PCR test, and along with other methods, it would allow to adjust the patients covid treatment in the hospital. Currently, gas analyzers are accurate research methods with a division value of 1 ppm. The purpose of this work is to identify which gases during the exhalation of infected or sick person are decisive, how to messure them during exhalation, how these gases are associated with entry proteins and enzymes of saliva? How change a gas concentrations depending from the infection and illness time, and what are their values? Keywords— : codivirus-infectious people by exhalation, gas analyzers.
• Introduction
The main route of covid infection is aerosolized saliva from person's mouth into mouth. Droplets are formed as result of coughing, sneezing or conversation [1,2].
Till three thousand infected small droplets are formed at coughing. Almost the same number of droplets are formed during 5-minute conversation [3]. A single sneeze produces up to 40,000 droplets of saliva with diferent dispersion to some meters [3]. Normal exhalation produces droplets of saliva that can be airborne up to 1 meter. Larger and heavier droplets of saliva tend to fall to the ground by ballistic trajectory. Small cloud droplets are formed and then with air currents are transported over longer distances [2,3]. Aerosols are solid particles suspended liquid in the air with ranging in size from 0.001 to 100 microns [3]. The time the droplets remain in the air travel depend from their size [3]. Large droplets (diameter > 60 µm) tend to settle quickly. Transmission via small droplets (diameter ≤ 60 µm) can occur over short distances (distance between people less than 1 m). There is possibility also that small droplets under favorable conditions will turn into airborne suspension of infectious particles (diameter <10 µm) and carried over longer distances [4].
In other words, oral cavity this is initial place of covid infection.
On the other hand, in the study of human venous blood was found that the concentrations of carbon dioxide and bicarbonates increase significantly, by 83% and 8.8%, respectively [5].
Besides, during covid infection observe for more half of sick persons a dry mouth and amblygestia (a dulling of the sense of taste). These symptoms arise from impaired tongue function from ACE2 expressing and furin and also ACE2 expression in the salivary glands [6].
Currently, there are gas analyzers for determining the concentration of gases with division value of 1 ppm or 0.000001 fractions in air. That's why it is technically possible to detect changing of the carbon dioxide and hydrocarbonate suspension concentrations in the air at covid contagiousness people at exhale for distance till 1 meter.
• Problem formulation
The technical task of this work was to create a gas analyzer with calibration for carbon dioxide and for suspended saliva hydrocarbons in the air based on the Arduino microcontroller with digital signal processing and comparing the results with calibration curves by this gases, with follow visualization of these changes on the screen, sensor buzzer and telegram channel messenger with a division value of 1 ppm. Research tasks are: 1. Is there an increasing of carbon dioxide and suspended saliva bicarbonates concentrations during human exhalation of infected covid patients and what is their percentage ratio? 2. How change the concentrations of carbon dioxide and saliva bicarbonates suspension at exhales person from day time illness? 3. How are change the carbon dioxide and saliva bicarbonate suspension concentrations related with two key input proteins known as the ACE2 receptor and the TMPRSS2 enzyme
Results and Discussion
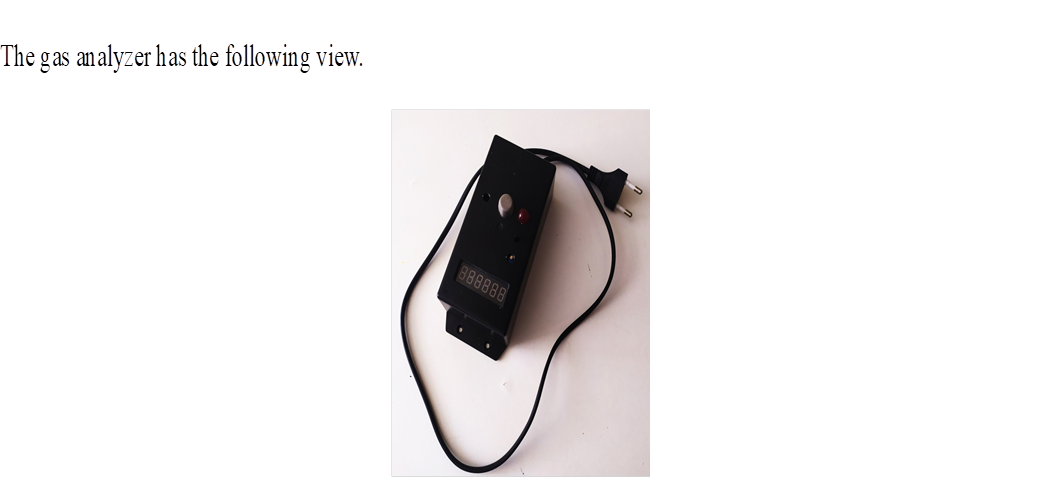
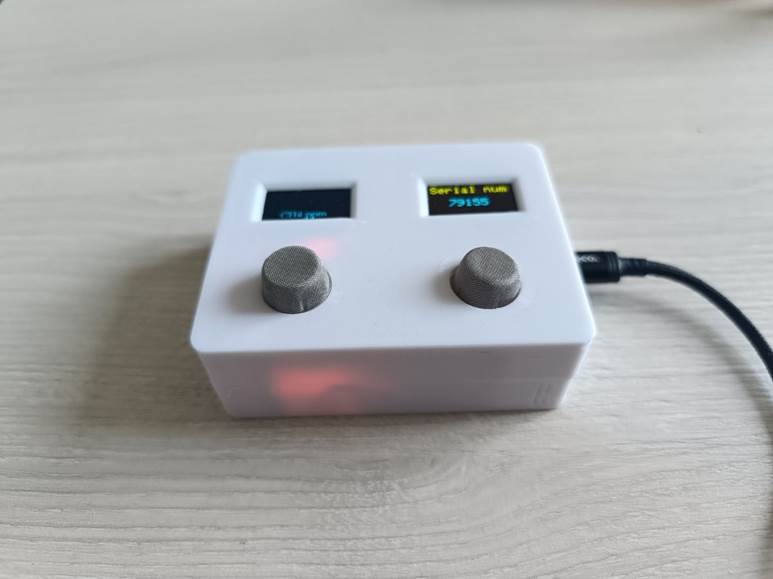
Fig.1. Gas analyzer
The device was calibrated for carbon dioxide and saliva bicarbonates suspension at 20 degrees Celsius at normal atmospheric pressure and humidity with pre-treatment by bactericidal lamp. Data gas concentrations were messured by 1 or 2 analog gas detectors of the arrays data concentrations carbon dioxide P1 extensional and saliva bicarbonates suspension P2 extensional for nonequilibrium measurement system with follow by comparison arrays data calibration curves functional E1 , sub functional E2 both gases and with subsequent recording of nonlinear
equations but already an equilibrium system measurements with interactions of both gases during exhalation in a mixture of atomospheric air and then followed by digitization on Arduino microcontroller [7-9].
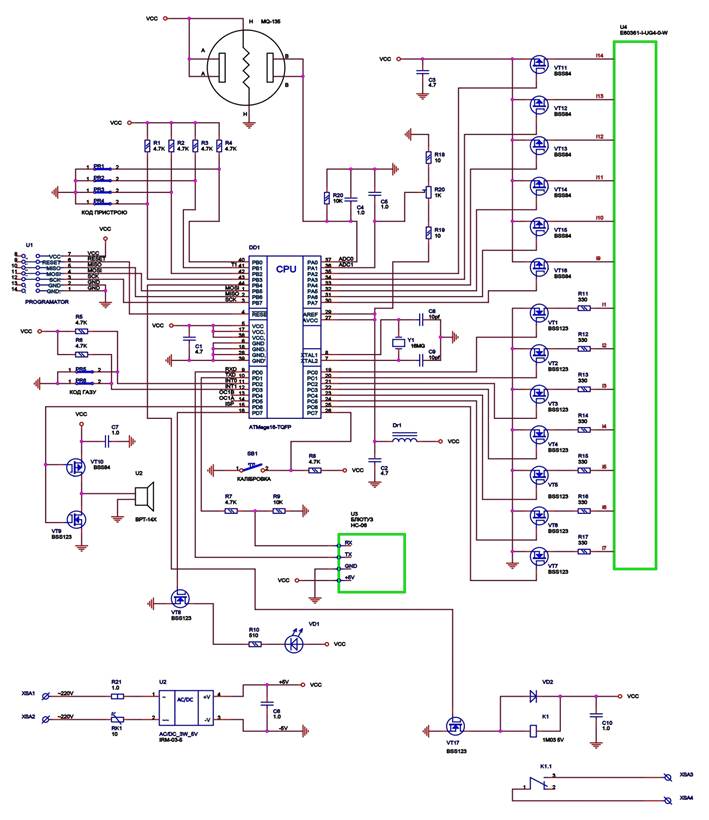
Fig.4. Gas analyzer scheme.
Analog signals are fed to the microcontroller. Below is a calculation of carbon dioxide concentration in air based on the calibration, experimental sensor resistance values, calculated analog-to-digital converter characteristics and the carbon dioxide value in air of the Global Atmospheric Bulletin for January 2022.
Res/E1 x E2 = [(adc0 х 0,1875/1000) x 4 x Rload] /E1 x E2 (1)
p = (Res/E1 x E2) /ATM0CO2 (2)
Res - detector resistance in Om,
E1 - temperature correction сoefficient,
E2 - humidity correction сoefficient,
Res/E1 x E2 - calculate concetration carbon dixide value in resistance detector units,
adc0 - analog detector value,
U=float (adc0) x 0,1875/1000, converting an analog detector value in voltage,
coefV = 0.1875, constant for the accuracy of the analog-to-digital converter,
d = 1000, divisor to get value in volts,
Res = U x 5 - 1, here a resistance detector calculation,
V = 4 V, 4 volt gas analyzer supply,
Rload - resistor value in Om,
p - carbon dioxide concetration in air in ppm,
ATM0CO2 = 417,99 ppm, carbon dioxide value in air in ppm at Global Atmosteric Bulletin, January, 2022. http//www.co2.earth/
Exactly the same calculation and for saliva bicarbonates concentration.
ATMbicarbonates = 16, 4 ppm , saliva bicarbonates concentration in air at health human exhalation defined by sampling of spectrofotometr Lambda 365, USA. Controlled also saliva samples of health and covid infected peoples and recieved a results 8-9,5 % in side of increesing, which is consistent with [5].
Calibration curves were built taking into account the temperature E1 and humidity E2 Winter-Summer regime at the Odessa latitudes and climate, Ukraine. To do this arrange a separate unit with temperature and humidity sensors into detector sheme. Other words, calculation сoefficients ATM0CO2 = 417,99 ppm and ATMbicarbonates = 16, 4 ppm enter 1 time after calibration curves built on experimental values of temperature and humidity detectors.
Their changes show the intensity for each concentration relationship and for 2 functional or their sub functional have the form:
P1 = f1 (E1 , E2 )
P2 = f2 (E1 , E2 ) Eq. (3), Fig. 5,6.
Differentiating among the equation, absolutely the outcome will be:
dP1 = A 11 dE1 + A 11d E2
dP2 = A 12 dE1 + A 12d E2 Eq. (4)
The state coefficient nonequilibrium messure system A connects the functional and intensials, when changing from one nonequilibrium state to another, coefficients A temperature and humidity changes. Obviously, the coefficient of state is also a show the carbon dioxide and saliva bicarbonates concentratins E2 of exhaled gases in the structure volumes of atmospheric air.
There are simple and cross-sectional coefficients of connections between singles structures of state and interactions of structures under distribution of exhaled gases in the volume of atmospheric air distributions. Basic and cross coefficients A in the form of corresponding functions of various functionals E, as for carbon dioxide can be outdoor wind speed, the presence of cars and air pollution with carbon monoxide; for saliva bicarbonates concentrations this can be also outdoor wind speed and the presence of detergents based on soda or soda drinks :
А11 = f11 (Е1, E2)
А12 = f12 (E1, E2)
А21 = f21 (Е1, E2)
А22 = f22 (E1, E2) Eq. (5)
We studied about 5,000 people with and without signs of covid in the street, quarantine and hospitals. The subjects exhaled air with open mouth for distance 10 cm. The values of gas concentrations were recorded on the display. Research has identified the following groups of people: 1. Healthy people who haven't any covid external signs and both gas concetrations no increase. 2. Healthy (infected -?) people who haven't any covid external signs of the disease, but have elevated concentrations of either carbon dioxide or both gases, possibly an asymptomatic form. 3. Infected people who have external signs of illness and have elevated concentrations of either carbon dioxide or both gases. 4. Sick people who have external signs of illness and have more elevated concentrations of both gases. 5.Sick people who have external signs of the disease, but recovering and having elevated concentrations of either carbon dioxide or both gases with tendency to decreasing.
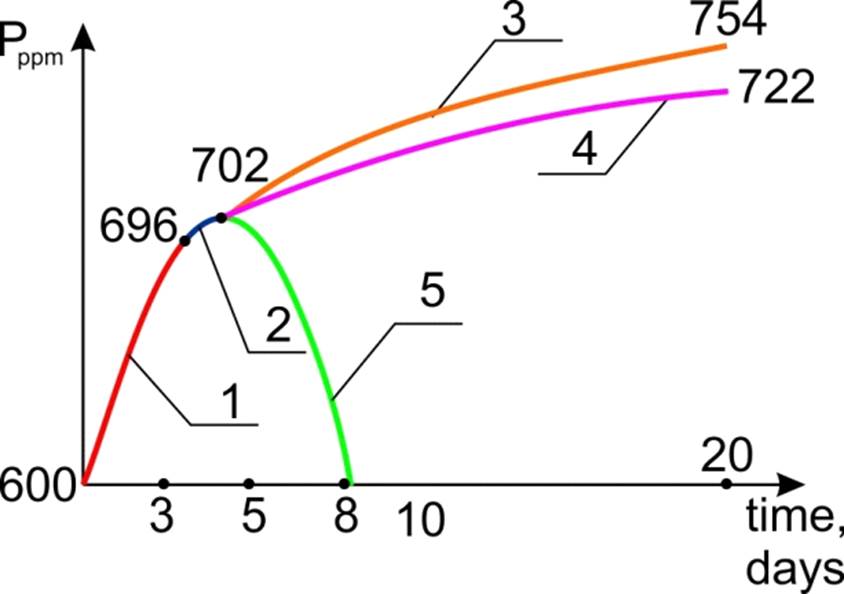
Fig.5. Curve of concentrations of carbon dioxide during exhalation of infected and sick people with covid.
The results of the research are presented by graphs of carbon dioxide concentrations (Fig.5) and suspensions of bicarbonates in saliva (Fig. 6) depending from infection day at exhalation. The counting of the curves is considered from start of infection for given room with values 630 and 35 ppm concentrations of carbon dioxide and suspended bicarbonates in saliva respectively. Curve 1 (red colour) is the area of infection with increasing of gas concentrations to 696 and 39 ppm of carbon dioxide and suspended bicarbonates respectively and corresponds to groups 2 and 3 of asymptomatic and infected people. Curve 2 (blue colour) is the area of disease stabilization with slight increases of gas concentrations to 702 and 40 ppm of carbon dioxide and suspended bicarbonates respectively.
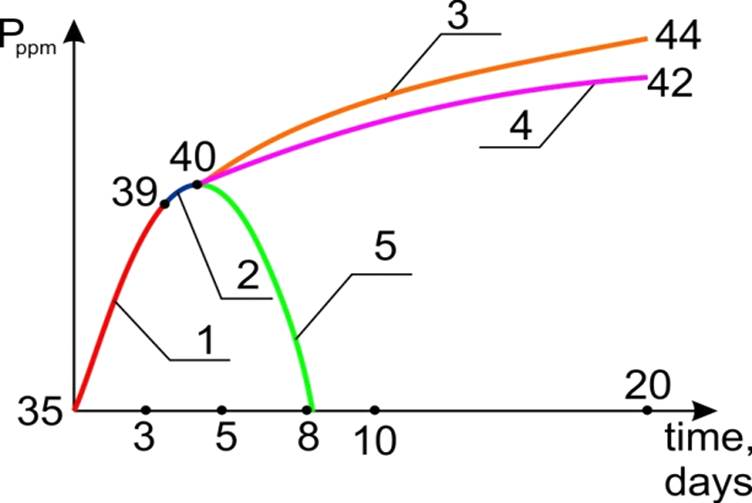
Fig.6. Curve of concentrations of suspension of bicarbonates in saliva during exhalation of infected and sick people with covid.
Curve 3 (orange colour) is a further escalation of the disease with increasing of concentrations to 722 and 42 ppm of carbon dioxide and suspended bicarbonates respectively and correspond to medium form of severity of covid illness. Curve 4 (crimson colour) is a further escalation of the disease with increasing of concentrations to 754 and 44 ppm of carbon dioxide and suspended bicarbonates respectively and correspond to heavy form of severity of covid illness. Curve 5 (green colour) show a recovery of human and decreasing a value both gas concentrations. The gas analyzer examines the process of infection through saliva in the oral cavity. If we consider curves 1 and 2 from the side of key entry proteins ACE2 receptor and the TMPRSS2 enzyme we can approve about infection development (Fig.5,6) [5], curve 2 as blocking the infection development in the body host human with codivirus colony. It correspond a results many researchers that 2-3 days after the first disease signs appear dry mouth and decrease the saliva production. Covid disease seems to spread to the bronchi and lungs.
• Conclusion
It is possible to detect covid illnesses by gas analyzers based on person’s exhalation. Carbon dioxide and a suspension of bicarbonates in saliva show a steady increasing to 150 and 20 ppm respectively. Both curves are characterized by the stage of infection, a sharp increasing in the concentrations of both gases from the first hours to 2-3 days of illness depending from different strains. Further, the disease stabilizes within 1-2 days. After that covid illness passes in medium or heavy form or the person recovers.
• Acknowledgements
I thank the editors of the Journal for their help and publication of this paper. Special thanks to my teacher prof. Alfred Veinik for the selection of my research in the thermodynamics of nonequilibrium systems in nature and research technologies.
REFERENCES
1. https://www.who.int/news-room/q-a-detail/q-a-coronaviruses#.
2. Kohn, W. G. et al. Guidelines for infection control in dental health-care settings-2003. MMWR Recomm. Rep. 52, 1–61 (2003).
3. Tang, J. W., Li, Y., Eames, I., Chan, P. K. & Ridgway, G. L. Factors involved in the aerosol transmission of infection and control of ventilation in healthcare premises. J. Hosp. Infect. 64, 100–114 (2006).
4. Fennelly, K. P. et al. Cough-generated aerosols of Mycobacterium tuberculosis: a new method to study infectiousness. Am. J. Respir. Crit. Care Med. 169, 604–609.
5. Dzemal Elezagic, Wibke Johannis, Volker Burst, Florian Klein and Thomas Streichert. Venous blood gas analysis in patients with COVID-19 symptoms in the early assessment of virus positivity. From the journal Journal of Laboratory Medicine/. https://doi.org/10.1515/labmed-2020-0126
6. Chen, L. et al. Detection of 2019-nCoV in Saliva and Characterization of Oral Symptoms in COVID-19 Patients. https://ssrn.com/abstract=3557140 (2020).
7. Vlastopulos Vladyslav, Plenary Lecture 2: «Creation of Electromagnetic Structure-Creating Spaces to Improve the Growth of Some Types of Cells and Albumins». Recent Advances in Biology, Biophysics, Bioengineering and Computational Chemistry Proceedings of the 5th WSEAS international conference on CELLULAR and MOLECULAR BIOLOGY, BIOPHYSICS and BIOENGINEERING (BIO’09) ISBN: 978-960-474-141-0, ISSN: 1790-5125
8. Vlastopulos V.I., Nikolaev V.G., Bioenergetic fields of the human brain rhythmus. The using in video, audio products for the creating attracted bioenergetic advertisement, article №9B1840, materials of conference EBSA2009, conducted since 11 to 15 July in Genoa, Italy, 2009.
9. Equations of Thermodinamics for Expansion and Filling by Human Civilization. Vlastopulo.V.I.1, Polichronidi.A.G2 IJ0ER-N0V-1.